Input Data
MSigDB
One simple way to obtain gene sets or pathway is through the MSigDB. After registration in here, you can download different gene sets curated by the Broad Institute. Alternatively, you can also generate your own gene sets in the GMT format:
[Set A] [Gene 1] [Gene 2] ...
[Set B] [Gene 1] [Gene 2] ...
Sometimes, the MSigDB file might store the URL for the gene set on the second column
[Set A] [url for set A] [Gene 1] [Gene 2] ...
And PRSet can properly handle that.
Gene GTF
As MSigDB file does not contain the genome boundary of the genes within the gene set, one must also provide a GTF file. A GTF file contains the genome boundary of the genetic elements within the human genome and PRSet can use the information from GTF to determine if a SNP falls within a specific gene. One can download the GTF file file Human (Genome build GTCh38.p7) here.
PRSet will look for any regions with feature of exon, gene, protein_coding or CDS (case sensitive).
Any genomic regions without these features will be ignored.
Alternatively, you can specify the features using the --feature command.
Note
For those who are unfamiliar, different version of the genome might differ slightly in their coordinates. Therefore it is vital to ensure all the files are originated from the same genome build
Bed Files
In addition, PRSet also accept bed file(s) as an input.
Important
A bed file must contain a minimum of 3 columns:
- chrom - The name of the chromosome (e.g. chr3, chrY, chr2_random) or scaffold (e.g. scaffold10671).
- chromStart - The starting position of the feature in the chromosome or scaffold. The first base in a chromosome is numbered 0.
- chromEnd - The ending position of the feature in the chromosome or scaffold. The chromEnd base is not included in the display of the feature. For example, the first 100 bases of a chromosome are defined as chromStart=0, chromEnd=100, and span the bases numbered 0-99.
PRSet will read in any number of bed files (comma separated) and use the file names as the name of the gene set.
Note
An annoying feature of bed file is that it starts with 0 whereas for example, the plink formats starts the coordinates at 1. So do remember to -1 from the region start when you build your own bed file from scratch.
SNP Set Files
Finally, PRSet also allow SNP sets, input via the --snp-set option.
Two different formats are allowed
- SNP list format, a file containing a single column of SNP ID. Name of the set will be the file name or can be provided using
--snp-set File:Name - MSigDB format: Each row represent a single SNP set with the first column containing the name of the SNP set.
Clumping in PRSet
In PRSice-2, clumping is performed to account for linkage disequilibrium (LD) between SNPs. However, when performing set based analysis, special care are required to perform clumping. Take the following as an example: Assume that:
- Light Blue fragments are the intergenic regions
- Dark Blue fragments are the genic regions
- Red fragments are the gene set regions
- SNPs are represented as thunder bolt, with the "index" SNP in clumping denoted by the green thunderbolt
If we simply perform a genome wide clumping, we might remove all SNPs residing within the gene set of interest,
reducing the signal:

Therefore, to maximize signal within each gene set, we must perform clumping for each gene sets separately:
 this can be a tedious process and are prone to error.
To speed up clumping, PRSice-2 adopt a "capture the flag" system.
Each SNPs contains a flag to represent their gene set membership. If a SNP is a member for the set, it will have a flag of 1, otherwise it will have a flag of 0. For example:
| SNP | Set A | Set B | Set C | Set D |
|---|---|---|---|---|
| SNP 1 | 1 | 0 | 1 | 1 |
| SNP 2 | 0 | 0 | 1 | 1 |
| SNP 3 | 1 | 1 | 0 | 1 |
If we use SNP 1 as the index SNP, then after clumping, we will have
| SNP | Set A | Set B | Set C | Set D |
|---|---|---|---|---|
| SNP 1 | 1 | 0 | 1 | 1 |
| SNP 2 | 0 | 0 | 0 | 0 |
| SNP 3 | 0 | 1 | 0 | 0 |
which removes SNP 2, but will retain SNP 3. This allow us to achieve set based clumping by only performing a single pass genome wide clumping.
P-value Threshold and Proxy Clumping
Options
Proxy PRSet
One complication in PRSet is the definition of SNP membership.
The default option of PRSet is to only include SNPs that are physically within the target region.
However, it is also likely for SNPs outside the region to influence functions of the set.
Therefore we provide the --proxy option. Essentially, this provide a soft cutoff to SNP membership.
For example, when user define --proxy 0.8, if LD between SNP A and SNP B is more than 0.8, then SNP A will be considered to be within the same regions as SNP B and vice versa.
P-value thresholding
By default, PRSet do not perform p-value thresholding and will simply calculate the set based PRS at P-value threshold of 1.
This is because it is unclear whether the set is associated with the phenotype when the best-threshold contained only a small portion of SNPs within the gene sets.
If you wish to perform p-value thresholding with PRSet, you will need to specify any of the parameters related to p-value thresholding, i.e. --interval, --lower, --upper, --fastscore or --bar-levels.
Competitive P-value Calculation
A challenge in Set base analysis is to obtain a competitive p-value, which indicates the level of enrichment, as opposed to the self-contained p-value which indicates the level of association. To obtain a competitive p-value, PRSet can perform a permutation analysis as follow
- Allocate SNPs to each gene sets
- Allocate SNPs to a background gene set
- if
--full-backis specified, use the whole genome as the background - if a background file is provided via the
--backgroundcommand, it will be used to construct the background set - otherwise, will try to use the GTF file provided from
--gtfcommand as the background (with feature filtering w.r.t--feature)
- if
- Perform set based clumping on all sets (including the background set)
- Obtain the p-value of association for the best threshold for each sets (\(P_{observed}\))
- While PRSet allow one to perform p-value thresholding on the set scores, we recommend against it as it is difficult to interpret the result. Using an extreme example, if only one SNP is included in the best threshold for a set, should we really consider this single SNP as representative of the gene set?
- For each gene set with \(N\) post-clump SNPs
- Randomly select \(N\) post-clump SNPs from the background set and construct a null PRS
- Calculate the p-value of association of the null PRS to obtain a null P-value (\(P_{null}\))
- Repeat 1-2 \(M\) times, where \(M\) can be set via
--set-perm - The competitive P-value is calculated as $$ \text{Competitive-}P = \frac{\sum_{n=1}^NI(P_{null}\lt P_observed)+1}{N+1} $$ where \(I(.)\) is the indicator function.
Computation Algorithm
Due to the number of operation required, the set based permutation are extremely time consuming. To speed up the set based permutation, we noted that in regression,
$$ Y\sim X\beta+C+\epsilon $$ and
will generate the same t-statistic for \(X\) in the first equation and \(Y\) in the second equation. Based on this observation, we can then do the following
- Generate a matrix \(A\) containing the phenotype of interest and the covariates
- Decompose matrix \(A\)
- For each new PRS calculated, solve \(PRS=A\beta+\epsilon\) and obtain the t-statistic. These t-statistics are then used to construct the null distribution, allow us to obtain the competitive p-value
As we only need to do the decomposition once, this should significantly increase the speed of set based permutation. In our test, for the TOY data, with --set-perm 5000, we can speed up the set-based permutation by around 20~25%
Note
With binary traits, unless --logit-perm is set, we will still perform linear regression as we assume linear regression and logistic regression should produce similar t-statistics
Output Data
PRS model-fit
A file containing the PRS model fit across thresholds is named [Name].prsice, where [Name] is the
output prefix name as specified by --out this is stored as
Name of Set, Threshold, R2, P-value, Coefficient, Standard Error, and Number of SNPs at this threshold
Scores for each individual
A file containing PRS for each individual at the best-fit PRS named
[Name].best is provide. This file has the format of:
FID,IID, In Regression, PRS at best threshold for Set 1, PRS at best threshold for Set 2, ...
Where the has phenotype column indicate whether the sample contain all the required phenotype for PRSice analysis (e.g. Samples with missing phenotype/covariate will not be included in the regression. These samples will be indicated as "No" under the in regression column)
If --all option is used, a file named
[Name].all.score is also generated
Please note, if --all options is used, the PRS for each individual at all threshold will be given.
In the event where the target sample size is large and a lot of threshold are tested, this file can be large.
This is especially true when large number of gene sets were provided.
Note
PRSice also supports multiple phenotypes for target data. All output prefix will change to [Name].[Pheno] where [Pheno] is the name of the phenotype. For more details on the options used to implement this, see here.
Summary Information
Information of the best model fit of each phenotype and gene set is stored in [Name].summary. The summary file contain the following fields:
- Phenotype - Name of Phenotype
- Set - Name of Gene Set
- Threshold - Best P-value Threshold
- PRS.R2 - Variance explained by the PRS. If prevalence is provided, this will be adjusted for ascertainment
- Full.R2 - Variance explained by the full model (including the covariates). If prevalence is provided, this will be adjusted for ascertainment
- Null.R2 - Variance explained by the covariates. If prevalence is provided, this will be adjusted for ascertainment
- Prevalence - Population prevalence as indicated by the user. "-" if not provided.
- Coefficient - Regression coefficient of the model. Can provide insight of the direction of effect.
- P - P value of the model fit
- Num_SNP - Number of SNPs included in the model
- Empirical-P - Only provided if permutation is performed. This is the empirical p-value and should account for multiple testing and over-fitting
- Competitive-P - Only provided if set permutation is performed. This is the competitive p-value and should measure the enrichment of signal of the gene set
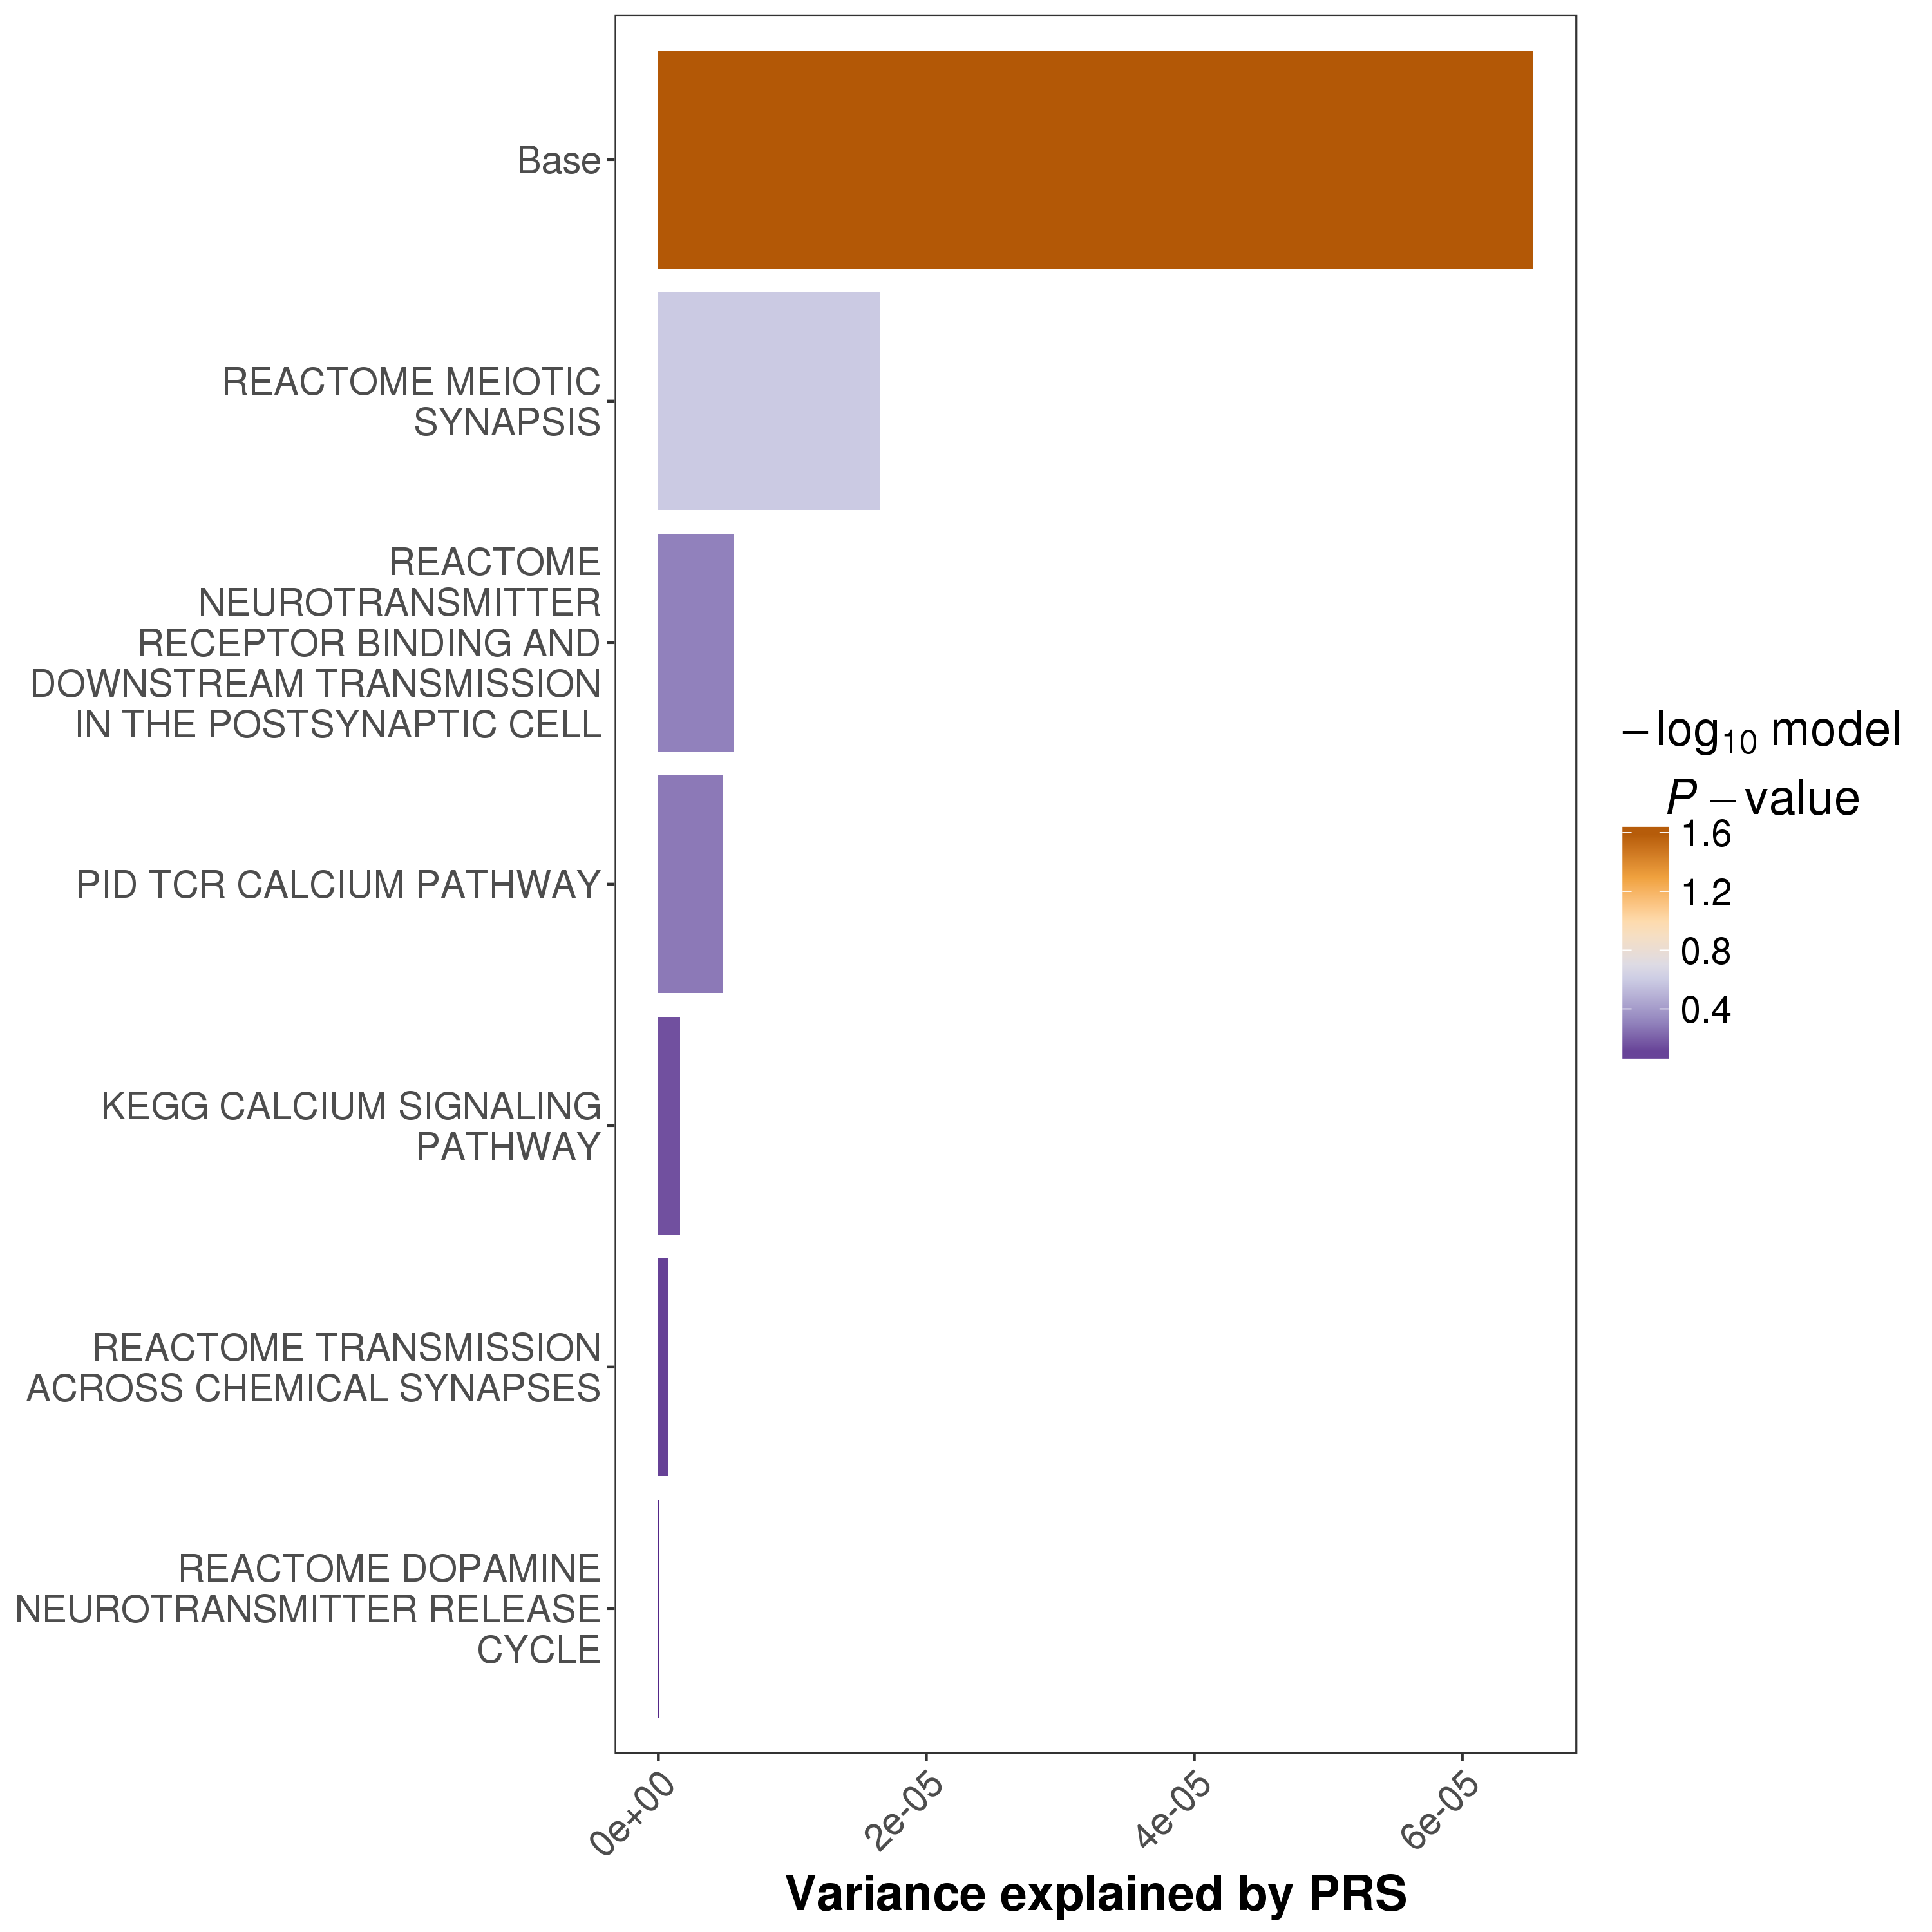
Multi-Set Plot
When the --multi-plot <N> option is set, the results of the top N gene sets will be plotted.
An example of the multi-set plot is:
Other Figures
The default behaviour of PRSet is to only plot the High-resolution plot, bar-plot and the quantile plot
for the "Base" data. You can change this behaviour by using the --plot-set option.
Log File
We value reproducible research. Therefore we try our best to make replicating PRSice run easier. For every PRSice run, a log file named [Name].log is generated which contain the all the commands used for the analysis and information regarding filtering, field selected etc.
This also allow users to quickly identify problems in the input dataset.